Optimizing condition-based maintenance decisions for vibration monitored bearings
We report the development of an optimal maintenance program based on vibration monitoring of critical bearings on machinery in the food processing industry. Statistical analysis of vibration data is undertaken using the software package EXAKT to establish the key vibration signals that are necessary for risk estimation.
A.K.S. Jardine, University of Toronto, Ontario, Canada
T. Joseph, University of Toronto, Ontario, Canada
D. Banjevic, University of Toronto, Ontario, Canada
Abstract
The paper reports on the development of an optimal predictive maintenance program for critical pump bearings in the food processing industry. Statistical analysis of vibration data is undertaken using the software package EXAKT to establish the key vibration signals that are necessary for risk estimation. Once the risk curve is identified using a proportional hazards model, cost data are then blended with risk to identify the optimal maintenance program. The structure of the decision making software EXAKT is also presented. Concludes that perhaps the most important benefit of the study was the realization by maintenance management that it is possible to identify key measurements for examination at the time of vibration monitoring - thus possibly saving on inspection costs.
Article type: Technical, Case Study.
Keywords: Maintenance, Model, Cost Minimization, Decision-Support Systems, Condition Monitoring.
Content Indicators: Research Implications*** Practice Implications** Originality** Readability**
Introduction
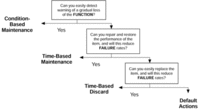
A valuable methodology to establish maintenance plans within an organization is reliability centered maintenance (RCM). The outcome of an RCM analysis can be the decision to subject some equipment within an enterprise to condition-based maintenance, through obtaining signals that enable the health of the equipment to be estimated. Figure 1 provides the basic methodology behind RCM.
figure 1:
Interpretation of the signals emanating from the condition monitoring of equipment (such as through the use of vibration monitoring) frequently is based on manufacturer's recommendations, use of an expert system, or use of threshold values established through the experience of inspectors (Wiseman and Jardine, 1999). Proportional hazards modeling (PHM), which is a sophisticated multivariate regression analysis procedure, aims to formally blend together data about the age of equipment along with the signals arriving from condition monitoring to estimate statistically the risk of the equipment failing at the time of inspection. Thus, the goal of PHM is to eliminate guesswork in estimating the risk of failure when equipment is subject to some form of predictive maintenance. An important by-product is the identification of the key vibration monitoring signals that need only be used for estimating the risk of an item failing. This is achieved using the method of maximum likelihood.
Optimizing CBM decisions
Proportional hazards modeling (Cox and Oakes, 1984) is valuable for estimating the risk of equipment failing, given that risk is a function of several variables (such as bearing age and the vibration measurements of velocity in the horizontal, vertical and axial directions along with acceleration). However, the goal of maintenance is to make economically justifiable decisions and PHM provides a basis to model the condition-based maintenance decision as a semi-Markov decision process whereby the issue of minimizing total cost (or another appropriate goal such as profit maximization or availability maximization) can be systematically addressed. The paper by Makis and Jardine (1992) presents a control theory approach that blends together economic considerations and PHM risk estimation to identify optimal replacement decisions.
Development of EXAKT: The CBM optimizer
In 1995, a project commenced at the University of Toronto to develop software that could be used by corporations currently conducting condition monitoring of their equipment. The organizations that have supported the project are:
- Alcoa Technical Center
- American Barrick Goldstrike Mining
- Campbells Soup
- Department of National Defence
- Dofasco Inc.
- Hong Kong Mass Transit Railway Corporation
- Molson Breweries
- Oliver Interactive Inc.
- PricewaterhouseCoopers
- Syncrude Canada Limited
- Wear-Check Canada
The overall purpose of the software is to enable consortium members to combine historical and condition-based information to establish lowest cost replacement decisions.
One of the main components of EXAKT is the Weibull PHM model. It is the backbone of the program in that it deals with the covariates (represented by Zi(t) in Figure 2, i = 1, 2 ... n) which are the monitored condition data.
figure 2:
Covariates associated with vibration monitoring, for example, will include measurements of velocity and acceleration.
The equation of figure 2:
Figure 2 incorporates the Weibull, or age based component, as well as the condition information, Zi(t), which can represent for example, the velocity in mm/s at the time of inspection. The values γi are known as the covariate parameters (i.e. they are weights that indicate the importance of the Zi measurement), one for each of the signals that are used for risk estimation. The EXAKT software details can be obtained from the Web site www.oliver-group.com (Jardine et al., 1998); the software uses multivariate regression analysis methods on historical failure and condition data to estimate the parameters β, η, \hbox { and } γi
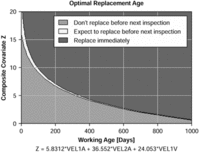
The next important component is cost. The costs of a planned maintenance replacement action versus those of a failure replacement are incorporated into the model. The outputs consist of a variety of graphs and tables which aim to unambiguously identify the optimal maintenance procedure, as well as to recommend specific actions in a given situation. Figure 3 is one such graphical output from which the optimal maintenance action at the time of inspection can be identified.
For the everyday maintenance practitioner who just wants to get a simple answer to a simple question, i.e. "Should we keep on running, or should we replace right now?", he or she will turn to the replacement decision chart ( Figure 3 ) and immediately find the unambiguous answer on this graph.
figure 3:
The software assumes that regular inspections are being carried out, so the position of the rightmost dot on the chart will provide one of three possible actions related to a weighted composite of current inspection results and the current time. The model is derived from the past history of failures and inspection results. One of the three choices - replace before next inspection - is a warning signal which says although the component is "getting close" to a possible failure event, the risk of failure combined with the benefits of running a while longer means that replacement may be delayed to a more convenient moment. It is an invaluable help in planning because it allows one to forecast the maintenance workload and downtime eventualities in the near-term - a disarmingly simple diagram, that in fact delivers possibly the most profound and extraordinarily useful output of the entire package.
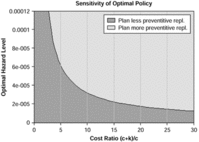
The "Sensitivity of optimal policy" graph of Figure 4 reveals, for a particular operation, just how important accurate cost data are to the ultimate replace-or-do not-replace decisions.
figure 4:
It allows one to get comfortable with two things: one is how the cost-data precision affects the hazard level (the level at which a replacement is recommended), and the other is whether one should plan less, or more, preventive replacements. The curve shows whether or not accurate cost data are required to identify the optimal policy. For example, if the cost ratio is between 15 and 25 - in the "flat" region - it indicates it is not crucial that a precise estimate of the ratio of the cost consequence of failure versus preventive replacement is required. On the other hand, due to the steep slope of the curve between a cost ratio of 2 and 4, this indicates that the optimal replacement decision is highly dependent upon the ratio - and therefore efforts should be made to obtain an accurate figure.
Still another feature of EXAKT is a Table ( Table I) - its name is the transition probability matrix - that shows the probabilities of going from one state (for example, very smooth vibration, smooth, rough, very rough) to another, between inspection intervals. Or more formally stated:
Table I:
The table provides a quantitative estimate of the probability that the equipment will be found in a particular state at the next inspection, given its state today.
Additional tools within the EXAKT software package allow for ODBC database connections and data manipulation and include results of statistical analysis, such as parameter-estimates, a goodness-of-fit test (residual analysis), confidence intervals, and expected values. In other words, the software is being developed in such a way that the user can create a convenient database by extracting the required information from external databases, perform data analysis and preprocessing using graphical and statistical analysis, estimate parameters of the PHM and Markov process models, compute and save the optimal replacement policy and make decisions for current records whenever it is required.
Clearly, to use the EXAKT package, one must have data. One needs to have records of the failures and preventive replacements of those components over time - lifetime data - and for these components their history of condition monitoring data. If the maintenance manager is concerned that he/she may be replacing components, parts, and assemblies too soon or too late, he/she must implement procedures to record accurate lifetime data along with condition inspection and test data. Maintenance tradespeople, who normally record part replacement data in their work order write-ups, should be trained to model the systems which they maintain using EXAKT software.
A double edged benefit can be thus gained - on the one hand a clear perspective of on-condition maintenance, and, on the other, a renewed motivation to provide accurate data to whatever maintenance information management system is in use.
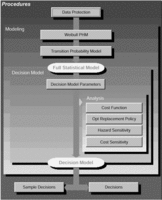
There is a natural intuitive interface (depicted in Figure 5) which steps the user through the modeling process. The paradigm is a flow chart or block diagram where each block represents a task in the modeling sequence from data preparation to decision.
Figure 5:
A case study
The study refers to a shear pump bearings in a food processing plant. Measurements are taken using an accelerometer which transfers the vibration data from the time domain (amplitude vs time) into the frequency domain (amplitude vs frequency) through a fast Fourier transform (FFT). The vibration parameters that indicate the health of the bearing are amplitude, frequency and phase.
For the bearings under investigation, at the sampling point measurements are taken in three directions: axial, horizontal and vertical. In each of these directions the FFT of the velocity spectrum is obtained in five frequency bands. In addition to velocity measurements in these bands, also acquired is overall velocity and acceleration in the three directions. This provides a total of 21 measurements (covariates in the EXAKT vocabulary) from the vibration instrument at the time of inspection. Table II is an illustration of the data acquired at the time of inspection.
Table II:
A simplified programming language has been developed and included in EXAKT to help the user to analyze the data using a number of statistical operations and to generate new variables by transforming the original data.
After data preparation, the user can start the estimation of the PHM by selecting a list of covariates that can include both the original and transformed variables, and then evaluate that model using residual and comparative analyses. The list of covariates can be further revised until a reasonable model is obtained.
When the PHM model was being built all 21 covariates were used, then through statistically checking the significance of the covariates it was concluded that, for this particular operating situation, only three were necessary, these being:
- two different velocity bands in the axial direction; and
- one velocity band in the vertical direction.
Table III:
Thus the PHM model used for risk estimation is: (see equation 1)
equation 1:
Thus for the above it is observed that the weightings associated with the three statistically significant covariates are: 5.83, 36.55, 24.05.
Once the PHM has been fitted, the user can estimate the transition probabilities used to conduct the stochastic behavior of the covariates. Table I provides the probability estimate of the bearing vibration proceeding from one state to another between inspections. For example, if the current reading of the measurement Vel1V (band 1 velocity in the vertical direction) was in the range 0.1 to 0.15 then there is a probability of 0.35 of the reading remaining in the same range during the next inspection period (20 days) and a probability of 0.26 of it moving into the next range.
The final step in the creation of the decision model is the calculation of the optimal replacement policy. The user should include the decision policy parameters: preventive and failure replacement costs, and set the inspection interval length. In the bearing example in this case the cost ratio was 9.0 to 1.0, taking into account the total cost associated with failure replacement of the bearing which included spoilt product, and the total cost of a preventive replacement which consisted of only a labour and parts cost. The inspection interval was set at 20 days.
It should be noted that the optimal policy tries to prevent costly failures, not only to predict their occurrence. It means that if the ratio of failure and preventive replacement costs (cost ratio) is high, the economical risk of failure could be very high, and then a preventive replacement is recommended, even if the hazard rate at given conditions is not very high.
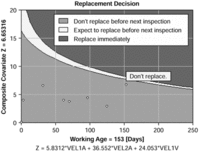
Figure 6, entitled condition-based replacement policy, shows the results for a recent set of inspections of the bearing, and the report that follows (not provided in this paper) indicates that the expected life of the bearing is 32 days before it reaches the time at which it should be removed for a preventive replacement.Case study conclusion
Possibly the most important benefit from the study was the realization by maintenance management that it is possible to identify the key measurements that should be examined at the time of vibration monitoring, thus possibly saving substantial funds through reduced inspection costs. In some situations this can translate into a reduction of condition monitoring equipment. Thus, the features within EXAKT can also be used to assist maintenance professionals to identify signals that should be monitored, thus eliminating unnecessary condition monitoring equipment.The future
The consortium members saw value in enhancing the functionality of the software, and have now funded the CBM Laboratory at the University of Toronto for a further three years, to 2001.
Extensions currently under way are in two areas:(1) Extensions to the software as it stands, being undertaken by CBM lab staff. (2) Research extensions, being undertaken by research students (currently five), that will develop new maintenance optimization models that will then be transferred to lab staff to incorporate into future releases of EXAKT.
Under 1 (software) we have:
- Incorporation of warning limits on the condition monitoring signals. This is similar to some current software but we believe we have a technique to make the limits "smart", such as having the limits vary as the equipment ages.
- Incorporation of extended utilization of the data included in the transition probability model.
- Incorporation of a new parameter: regular maintenance interval in the CBM model. This parameter should represent minor repairs and improvements of the equipment performed regularly in time between replacements, such as technical services.
- Improvement of the optimal decision options intended for decision making to make it simple and user friendly, such as to separate it completely from the modeling options, and many others.
- Modifying the model in EXAKT to handle equipment that is subject to continuous on-line monitoring. Presently, we deal with equipment that is inspected at regular intervals.
- Developing a model to establish the best inspection interval. This will take into account the cost of inspection and may result in varying intervals, such as longer intervals when the equipment is new, then shorter intervals as the equipment ages. (At present we accept the inspection interval that a company has in place, and then use EXAKT to make best decisions at these inspections).
- Develop models to handle "repairable systems". Presently, we assume (as do most maintenance models) that the maintenance action returns the equipment to the "as good as new" condition. While this may be the case there are many situations where we make a fix then let the equipment continue to operate, then later do an overhaul. Both the "fix" (a minimal repair) and the "overhaul" (a general repair) will be incorporated into the EXAKT optimization model.
The considerable and potential value of data can be realized by making good statistical analysis methodology accessible to maintenance professionals who strive to find a roadmap through the many decisions in the course of their everyday activities. Existing maintenance information management database systems are under-used and inadequately populated mainly because maintenance tradespeople and employees are not yet convinced that there is a relationship between accurately recorded component lifetime data and their own effectiveness to keep the physical assets of their organization functioning. It is to be hoped that the tools herein described will assist equipment maintenance personnel in their decision making tasks as they progress towards optimizing their maintenance decisions.References
Cox, D.R., Oakes, D., 1984, Analysis of Survival Data, Chapman and Hall, London.
Jardine, A.K.S., Banjevic, D., Makis, V., 1998, Optimal replacement policy and structure of software for condition-based maintenance, Journal of Quality in Maintenance Engineering, 3, 2, 109-19.
Makis, V., Jardine, A.K.S., 1992, Optimal replacement in the proportional hazards model, INFOR, 30, 172-83.
Wiseman, M., Jardine, A.K.S., 1999, Proportional hazards modeling: a new weapon in the CBM arsenal, Proceedings of Condition Monitoring 99, Coxmoor Publishing, UK, 359-66.

