 |
|
|
|
|
|
|
|
|
|
||
|
|
|||||||||
By Murray Wiseman
and Daming Lin
Optimal
Maintenance Decisions (OMDEC) Inc.
(Extracted
from Appendix 6 of Reliability-Centered Knowledge)
|
|
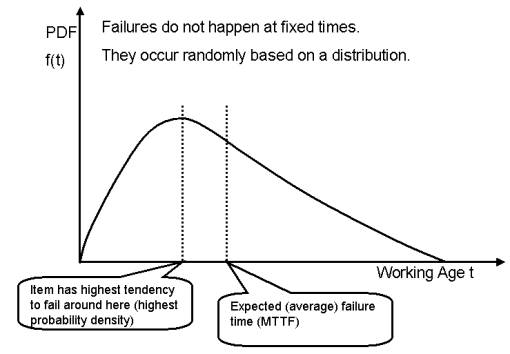
f(t) is the probability
density function (PDF). It is the usual way of representing a failure distribution (also known
as an “age-reliability relationship”). As density equals mass per unit
of volume[1], probability
density is the probability of failure per unit of time. When multiplied by
the length of a small time interval at t, the quotient is the probability of
failure in that interval. The PDF is the basic description of the time to
failure of an item. The PDF is often estimated from real life data. It
resembles a histogram[2]
of the failures of an item in consecutive age intervals. All other
functions related to an item’s reliability can be derived from the PDF. For example: |
F(t) is the cumulative
distribution function (CDF). It is the area under the f(t) curve
from 0 to t.. (Sometimes called the unreliability, or the cumulative
probability of failure.)
R(t) is the survival
function. (Also called the reliability function.) R(t) = 1-F(t)
h(t) is the hazard rate.
(At various times called the hazard function, conditional failure rate,
instantaneous failure probability, instantaneous failure rate, local failure
rate, a component of “risk” – see FAQs 14-17.)
h(t) = f(t)/R(t)
The conditional
probability of failure[3] = (R(t)-R(t+L))/R(t)
is the probability that the item fails in a time
interval [t to t+L] given that it has not failed up to time t. Its graph
resembles the shape of the hazard rate curve. When the interval length L is
small enough, the conditional probability of failure is approximately h(t)*L.
H(t) is the cumulative
hazard function. It is the integral of
h(t) from 0 to t, or the area under the hazard function h(t) from 0 to t.
MTTF is the average time
to failure. (Also called the mean time to failure,
expected time to failure, or average life.) MTTF = ![]() .
.
Do you have any comments on this article? If so send them to murray@omdec.com.
[1] However the analogy is accurate only if we imagine a volume of non-uniform mass. The density of a small volume element is the mass of that element divided by its volume
[2] A histogram is a vertical bar chart on which the bars are placed adjacent to one another along a horizontal axis scaled in units of working age. The width of the bars are uniform representing equal working age intervals. The height of each bar represents the fraction of items that failed in the interval. If the bars are very narrow then their outline approaches the pdf.
[3] Often, the two terms "conditional probability of failure"
and "hazard rate" are used interchangeably in many RCM and practical
maintenance references. In those references the definition for both terms is:
the conditional probability that an item will fail during an
age interval given that the item enters (or survives) to that age
interval. This definition is not the one usually meant in reliability
theoretical works when they refer to “hazard rate” or “hazard function”. Nowlan
and Heap point out that the hazard rate may be considered as the limit of the
ratio (R(t)-R(t+L))/(R(t)*L) as the age interval L tends to zero.
To summarize, "hazard rate" and "conditional probability of failure" are often used interchangeably (in more practical maintenance books). The “hazard rate” is commonly used in most reliability theory books. The conditional probability of failure is more popular with reliability practitioners and is used in RCM books such as those of N&H and Moubray. There are two versions of the definition for either "hazard rate" or "conditional probability of failure":
1. h(t) = f(t)/R(t)
2. h(t) = (R(t)-R(t+L))/R(t).
where L is the length of an age interval.
Actually, when you divide the right hand side of the second definition by L and let L tend to 0, you get the first expression.
Since F(t)=1-R(t)
Then differentiating
f(t)= -dR(t)/d(t)
Dividing the right side of the second definition for h(t) by L and letting L tend to 0 (and applying the derivative definition of a limit)
Lim R(t)-R(t+L) = (1/R(t))( -dR(t)/dt) = f(t)/R(t)
Là0 LR(t)
Note that, in the second version, t is not continous as in the first version. For example, you may have t=0,100,200,300,... and L=100.
Actually, not only the hazard function, but pdf, cdf, reliability function and cumulative hazard function have two versions of their defintions as above. The first version is defined over a continous range of age t while the second one is defined over discrete age intervals, e.g., (0,100), (100,200), (200,300), ... Roughly, we can say the second definition is a discrete version of the first definition.
The first expression is useful in reliability theory and is mainly used for theoretical development. The second expression is useful for reliability practitioners, since in practice people usually divide the age horizon into a number of equal age intervals. The pdf, cdf, reliability function, and hazard function may all be calculated using age intervals. The results are similar to histograms, rather than continous functions obtained using the first version of the definitions.
|